 عربي
عربي
Palestinian Central Bureau of Statistics (PCBS)
Palestinian Central Bureau of Statistics (PCBS) releases Statistical Report on Air Emissions
The Palestinian Central Bureau of Statistics has issued a statistical report on air emissions. The main objective of this report is to provide estimates and calculations of air emissions in Palestine. The report defines the methodology used to calculate emissions of the following pollutants: SO2, NOx, CO2, CH4, N2O and NMVOC (non-methane volatile organic compounds). The report estimated the emissions during the period ten years ago.
Carbon Dioxide CO2
The amount of carbon dioxide emitted from the energy, agriculture and solid waste sectors during 2011 was estimated at around 3.1 million tons, distributed into 2.7 million tons from the energy sector, 326 thousand tons emitted from agriculture and the remaining 63 thousand tons emitted from the solid waste sector (open burning of solid waste).
Amounts of Carbon Dioxide Emitted in Palestine from Energy, Agriculture and Waste Sectors, 2001-2011

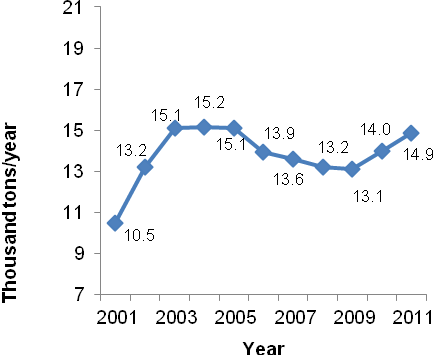
Methane CH4
The amounts of methane emitted from the energy, agriculture and solid waste sectors during 2011 was estimated at around 14,852 tons, distributed as 3,305 tons from the energy sector, 7,137 tons from agriculture and the remaining 4,410 tons from the solid waste sector (open burning of solid waste).
Amounts of Methane Emitted in Palestine from Energy, Agriculture and Waste Sectors, 2001-2011
Nitrous Dioxide N2O
The amounts of nitrous dioxide emitted from the energy, agriculture and solid waste sectors during 2011 was estimated at around 783 tons, distributed into 116 tons from the energy sector, 567 tons from agriculture and the remaining 100 tons from the solid waste sector (open burning of solid waste).
Amounts of Nitrous Dioxide Emitted in Palestine from Energy, Agriculture and Waste Sectors, 2001-2011

Per Capita Carbon Dioxide Emissions
Total per capita carbon dioxide emissions for 2011 in Palestine were around 1.04 tons/capita per year, distributed in different proportions by sector. In 2001 per capita carbon dioxide emissions were 0.82 tons / capita per year.
Per Capita Carbon Dioxide Emissions (tons/capita/year) in Palestine, 2001-2011

These data were compared with those published on the website of the statistical commission of Islamic countries and other emissions’ websites and the results appear in the figure above.
GDP per emissions
Number of the studies confirm the existence of a relationship between economy and emissions, the summary of these studies showed that; the higher value of the GDP per emissions the higher economy of the countries with low emissions, such as in Switzerland the value of this indicator is 9,293, Norway (8,381) and Sweden (7,740). The lowest value of this indicator showed that countries economy is weak with high level of emissions such as Uzbekistan (147), Mongolia (334) and Ukraine (338).
The final findings of the National Accounts for 2011 showed that the Gross Domestic Product in Palestine at constant prices was 6,421.4 USD million. The total quantity of emissions measured in tons of CO2 in 2011 in Palestine was 4.351million tons.
Based on these data, the GDP per emissions in USD per ton was calculated to be 1,476 USD / ton.
GDP per emissions in USD per ton in Palestine, 2001-2011

Comparing these data with those published on the website of the International Energy Agency, the results were as follows:
GDP per emissions in USD per ton for selected countries, 2009
|
Country |
GDP per emissions in USD per ton |
|
Jordan |
716 |
|
Lebanon |
1,464 |
|
Egypt |
644 |
|
Israel |
2,044 |
The estimates of air emissions 2001-2011 are based on the 2006 IPCC Guidelines for National Greenhouse Gas Inventories (2006 guidelines).