 عربي
عربي
The Palestinian Central Bureau of Statistics (PCBS) and the Palestinian Meteorological Directorate (PMD) jointly issued a press release on World Meteorological Day (WMD)
under the theme "Observing Today, Protecting Tomorrow."
Every year on March 23rd, the World Meteorological Organization (WMO) celebrates World Meteorological Day. This year's theme is "Observing Today, Protecting Tomorrow".
The following are the most important features of the climate that prevailed in 2025:
Rain monitoring Stations in Gaza Strip are out of service after being destroyed during the Israeli aggression
Gaza Strip has (12) rain monitoring stations distributed from the north to the south. However, with the outbreak of the Israeli aggression on October 7th, 2023, all these stations were destroyed, resulting in the total loss of their data. Consequently, they will not be included in this report due to the unavailability of any recorded data.
Improvements in rainfall compared to the previous year
Based on the PMD data, the recent rainy season (2025/2026) until 16/03/2026 in the West Bank has improved significantly compared to last year, with widespread rainfall across the West Bank, particularly during December and January. The heaviest rainfall was concentrated in parts of the northern and middle West Bank, as well as in the southern West Bank, which experienced a good rainy season. Data showed that Salfit Station received the highest rainfall during the rainy season, totaling 628 mm, representing 90% of the mean average. On the other hand, Jericho Station received the lowest rainfall during the season, with only 121.1 mm, representing 73% of the mean average.
Cumulative Amounts of Rainfall Recorded at West Bank Stations from the Beginning of the Current Rainy Season 2025/2026 until 16/03/2026 Compared with Mean Average by Station Location
|
Station Location |
Quantity of Rainfall till 16/03/2026 (mm) |
Mean Average (mm( |
% of Mean Average |
|
Salfit |
628.0 |
698.1 |
90 |
|
Tulkarm |
525.1 |
602.4 |
87 |
|
Ramallah and Al-Bireh |
506.0 |
615.2 |
82 |
|
Hebron |
499.9 |
595.9 |
84 |
|
Qalqiliya |
485.0 |
624.9 |
73 |
|
Jerusalem |
451.3 |
537.0 |
84 |
|
Bethlehem |
437.4 |
518.4 |
84 |
|
Nablus |
423.8 |
660.1 |
64 |
|
Jenin |
388.6 |
468.2 |
83 |
|
Tubas |
308.5 |
431.2 |
72 |
|
Jericho |
121.2 |
166.0 |
73 |
The highest humidity is in Hebron, and the lowest is in Jericho
In 2025, data showed that the relative humidity varied between 71% at Hebron Station and 41% at Jericho Station. It is important to note that high humidity levels do not necessarily indicate rainfall and could be in the form of other water phenomena, such as fog, clouds touching the earth's surface, or dew formation.
Mean Relative Humidity (%) in 2025 and Mean Average at Some West Bank Stations
|
Station |
Relative Humidity (%), 2025 |
Mean Average % |
% of Mean Average |
|
Hebron |
71 |
62 |
114.5 |
|
Ramallah and Al-Bireh |
64 |
75 |
85.3 |
|
Jenin |
64 |
69 |
92.8 |
|
Nablus |
61 |
61 |
100.0 |
|
Jericho |
41 |
52 |
78.8 |
Jericho Station exceeds the evaporation mean average, while Nablus has the lowest.
Data showed that the total evaporation at the West Bank stations during 2025 was within the mean average. The highest amount of 2,811 mm was observed at Jericho Station and the lowest amount of 1,679 mm was observed at Nablus Station. It is worth noting that high temperatures and wind activity in the region influence the amount of evaporation.
Total Evaporation and Mean Average of Evaporation at Some West Bank Stations, 2025
|
Station |
Total Evaporation (mm), 2025 |
Mean Average (mm) |
% of Mean Average |
|
Jericho |
2,811 |
2,101 |
133.8 |
|
Ramallah and Al-Bireh |
1,825 |
1,889 |
96.6 |
|
Nablus |
1,679 |
1,682 |
99.8 |
|
|
|||
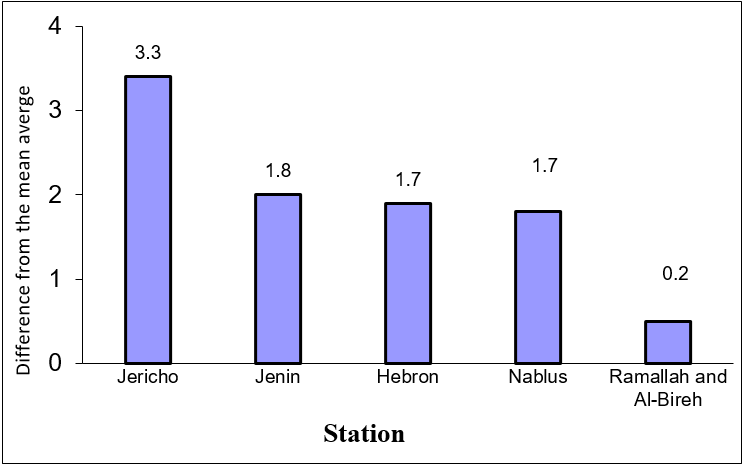
Air temperatures in 2025 are higher than the mean average
Air temperatures in the West Bank in 2025 were analyzed using data from selected stations representing the different climate zones. Including mountainous, semi-coastal and Al-Aghwar region. The results showed that air temperatures in 2025 were higher than the mean average for all stations especially at Jericho Station by 3.3 °C
This significant increase in air temperatures can be attributed to heat waves that affected the West Bank during July and August. These heat waves were also accompanied by a marked increase in humidity levels in the same areas.
Variations in Air Temperatures (°C) from Mean Average at the West Bank Stations in 2025
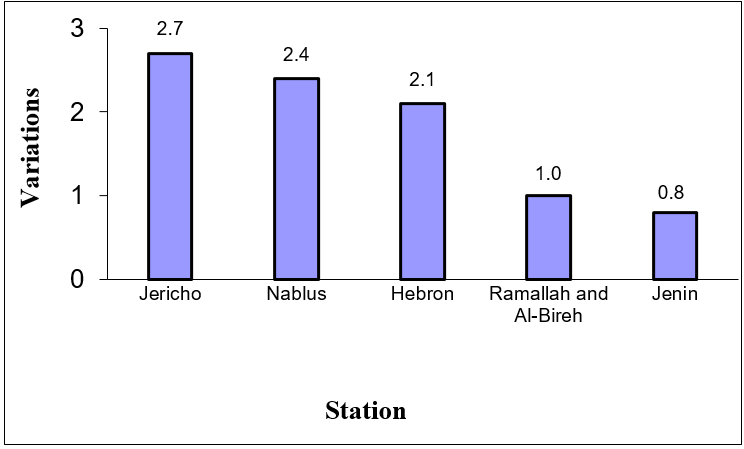
In 2025, maximum temperatures varied across the West Bank stations, showing notable variation, where Jenin Station witnessed a temperature increase of approximately 0.8°C higher than the mean average, while Jericho Station recorded a difference of 2.7°C.
Variations in Maximum Air Temperatures in 2025 (°C) from the Mean Average at the West Bank Stations.
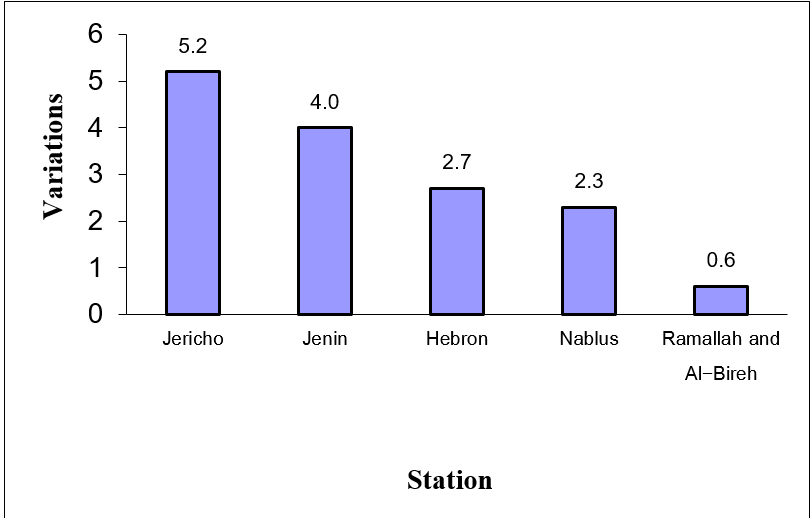
In 2025, minimum temperatures at Ramallah and Al-Bireh Station were higher than the mean average by around 0.6 °C, while at Jericho Station, they were higher by 5.2 °C.
Variations in Minimum Air Temperatures Compared to Mean Averages at Selected West Bank Stations in 2025.
Jericho Station had the highest atmospheric pressure in 2025
Data indicate that the average atmospheric pressure at Jericho Station was 1,046.9 millibars in 2025, which is the highest value, while Hebron Station recorded the lowest value, reaching 904.2 millibars.