 عربي
عربي
Palestinian Central Bureau of Statistics (PCBS)
Consumer Prices Index during 2025
Palestine's Consumer Price Index (CPI) witnessed a substantial increase’s, by 21.93% in 2025 compared to 2024, which propelled by unprecedented price volatility and hyperinflationary levels within the Gaza Strip markets, as a result of the Israeli aggression against Gaza Strip since October 7th, 2023, consumer prices increased by 21.93% in Gaza Strip, and by 1.64% in Jerusalem J1*. While it decreased by 0.11% in the West Bank**.
The table shows the percent change in the CPI during the last four years by region:
|
Year |
Palestine |
West Bank** |
Gaza Strip |
Jerusalem J1* |
|
2022 |
3.74 |
3.74 |
3.16 |
4.70 |
|
2023 |
5.87 |
4.77 |
10.53 |
4.05 |
|
2024 |
53.67 |
2.48 |
237.98 |
3.84 |
|
2025 |
10.54 |
0.11- |
21.93 |
1.64 |
|
2025 - 2022 |
86.57 |
11.26 |
369.90 |
14.97 |
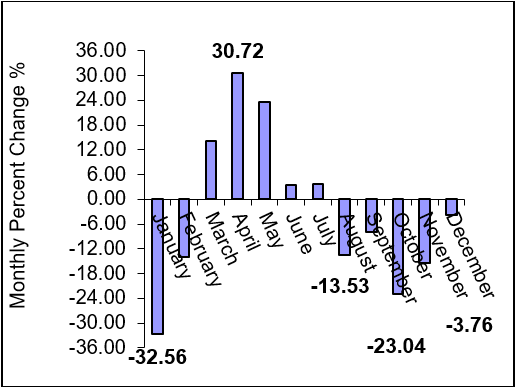
Consumer Price Index (CPI) in Palestine during 2025
Monthly percent changes in Consumer price index in Palestine for the months of 2025
The changes in Palestinian CPI for 2025 were traced back to changes in prices of the following expenditure major and sub groups compared with previous year:
|
Major and Sub Groups |
%Change |
|
Housing, Water, Electricity, Gas and Other Fuels |
+ 84.09% |
|
Gas |
+ 297.58% |
|
Food and Non-Alcoholic Beverages |
+ 35.89% |
|
Other Sugar and Sugar Substitutes |
+ 125.82% |
|
Eggs |
+ 109.72% |
|
Dried Vegetables |
+ 107.18% |
|
Bread - kmaj |
+ 64.32% |
|
White Flour |
+ 43.44% |
|
Fresh Fruit |
+ 42.62% |
|
Coffee |
+ 40.49% |
|
Canned Vegetables |
+ 37.22% |
|
Vegetable Oil |
+ 30.63% |
|
Fresh Chicken |
+ 29.69% |
|
Fresh Meat |
+ 23.08% |
|
Fresh Vegetables |
+ 18.99% |
|
Dried Pluses |
+ 18.48% |
|
Potatoes and Other Tubers |
+ 15.21% |
|
Transport |
+ 5.13% |
|
Liquid Fuel for Car "Petrol" |
+ 15.86% |
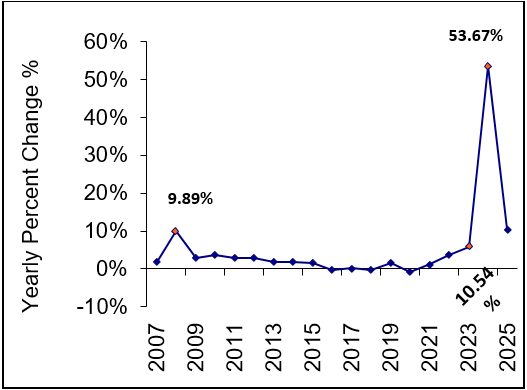
Consumer Price Index since 1996
Consumer Price Index increased by 284% over the period from 1996 up to 2025; this equates to an incremental increase of 2,884 NIS for every 1,000 NIS. So, if it is calculated since 2004, the CPI increased by 172%; this equates to an incremental increase of 1,721 NIS for every 1,000 NIS., it should be noted that the erosion of wages and salaries reached about 147% from 2008 to 2025 due to continuous increases in prices over the past years.
Yearly percent changes in Consumer price index in Palestine for: 2007 – 2025
Notes:
*Data represent those parts of Jerusalem, which were annexed by Israeli Occupation in 1967.
**Data exclude those parts of Jerusalem, which were annexed by Israeli Occupation in 1967.
The prices of goods and services were collected in New Israeli Shekels (NIS). The yearly average exchange rate of the US Dollar during 2025 is (3.45 NIS/$).
Due to the Israeli aggression against Gaza Strip since October 7th, 2023, the data for 2025 were collected through direct phone contact with PCBS fieldworkers working in Gaza Strip. They focused on the prices for basic commodities purchased by them and those that are of high relative importance within the main major groups of expenditure in the consumer price index.
Consumer Price Index for Palestine is weighted according to household expenditure and consumption ratios for the year 2016-2017 at the level of the Palestinian territories as follows: (0.66% for the West Bank**, 0.21% for Gaza Strip, and 0.13% for Jerusalem J1*).
Please note that the press release in English is brief compared to the Arabic version